Production and demand
The most significant feature of the chart up top is the dog leg in production growth in 2004. Prior to then the flow of new oil field projects combined with increasing utilisation of spare capacity allowed global oil production to grow and to meet much of the growth in demand.
In 2004, OPEC spare capacity fell close to zero (see below) and the world struggled for a number of reasons to bring on new supply to compensate for decline (see below). The slowing of production growth has meant new supplies are insufficient to meet growing demand and the price has gone up to balance the books. Higher prices stimulate conservation that may take the form of fuel efficiency (driving a smaller car) or abstinence (poor people being priced out of the energy market).
Every year a large number of new oil fields are brought on line. However, this does not directly translate to growth in supplies since amongst other things the production decline in existing fields needs to be replaced first:
new annual production capacity = consumption growth + annual decline + spare capacity growth
Decline
All oil wells, oil fields and oil provinces are exposed to a phenomenon called decline. Producing oil depressurises the sub-surface reservoirs and uses up the reserves. With time the proportion of water to oil that is produced in any well increases (increasing water cut) and this combined with depressurisation leads to declining oil flow rates.
Combined, these processes result in naturally declining production. It has been estimated that the global average decline rate is 4.5% per annum. (personal communication, Peter Jackson, CERA). What this means is that every year the global oil industry must bring on stream 3.8 million barrels per day new production just to compensate for decline (4.5% of 85 mmbpd). If less than 3.8 million bpd are commissioned then global oil production will fall and vice versa.

The higher global oil production rises, so rises the amount of new annual capacity required to compensate for decline.
As global oil production has risen, the annual new capacity required to offset decline has gone up too. Bearing in mind that all the best fields have already been produced, annual decline must be offset using second and third class oil fields. This task eventually becomes impossible and a production plateau is attained. That is where we are right now.
Net energy and energy density
The world has already used up a large proportion of its best oil reserves. These are the light sweet crude oil reserves produced on shore from first class reservoirs.
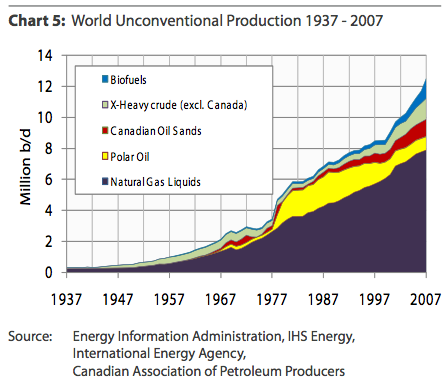
The proportion of low ERoEI liquids and low energy density liquids is growing exponentially. Source EIA and Oil Watch Monthly.
This chart shows that a growing proportion of world total liquid fuels production comprises second generation liquids - e.g. natural gas liquids, syncrude from tar sands and biofuels.. These are essentially synthetic liquids that need to be created and the process of creation uses energy. The term used to describe this concept is Energy Return on Energy Invested (ERoEI) and while historic oil production may have had large ERoEI numbers greater than 100, these synthetic liquids have low ERoEI. Around 1.2 in the case of temperate latitude ethanol and 5.0 in the case of syncrude produced from tar sand. The main point is that a steadily growing proportion of the global total liquids production is being used to produce these liquids leaving less for society to use than the bare figures may suggest.
ERoEI = (energy contained in fuel) / (energy used to produce fuel)
When the energy used to produce a fuel is larger than the fuel itself contains the ERoEI will be less than 1 and the whole exercise is rather pointless apart from in exceptional circumstances where energy quality is very important, e.g. in food production.
A second and equally serious issue lies in the energy density of the new liquids being produced. In energy terms, 1 barrel of ethanol or a barrel of liquefied natural gas is not the same as a barrel of crude oil. The latter contains significantly more energy. Hence measuring energy production by the volumes produced (barrels) is misleading and presents an over-optimistic picture.
As a rough approximation, the energy equivalence by volume of ethanol and LNG are as follows:
1 barrel of ethanol = 0.61 barrels of crude oil
1 barrel of LNG = 0.73 barrels of crude oil
In summary, the picture of rising liquids volume production up top is deceptive. With the passage of time the energy content of those liquids is falling steadily and the amount of energy used to produce them is rising. This means less energy for society to use at a higher cost.
31.8 billion barrels per year
The world now consumes 31.8 billion barrels of oil per year. 1978 was the last year that this volume of oil was discovered and more recently discovery has been running at less than 10 billion barrels per year. It is an utterly forlorn hope that exploration and new discoveries may alleviate the current supply crisis.
Mega projects
The inventory of past discoveries has not yet been used up and a list of new oil mega-projects first complied by Chris Skrebowski has been expanded and maintained by The OIl Drum in Wiki format.
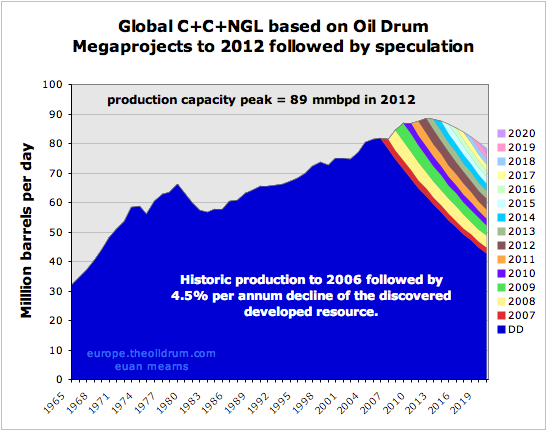
Global crude + condensate + NGL + syncrude scenario based on TOD mega-projects database as of 27 May 2008. This is not a definitive forecast since there is uncertainty over decline rate, project slippage and there is no allowance made for small projects. Beyond 2012 there is a planning horizon for projects and so beyond that date is pure speculation based on 10% per annum decline in new production capacity - and this may contribute to the apparent peak at that time. The 4.5% per annum decline rate is based on a personal communication with Peter Jackson (CERA) who conducted a comprehensive study of oil field decline last year. This decline is applied also to new production.
At face value, these mega-projects should be sufficient to ensure some production growth in the coming years.
However, the pattern of recent years has been project slippage owing to global shortages of materials, manpower and rampant oil service sector inflation. The pattern of slippage may continue and the promise of an increase in new supplies may remain just that – a promise.
Spare production capacity and OPEC
It is a feature of natural resource depletion that there is either a glut or a shortage. Managing this during the early years of resource exploitation causes all sorts of problems. On planet Earth we need to be thankful to OPEC for trying to manage this problem via their production-sharing cartel. For much of the period since OPEC formed in 1960, the world had excess productive capacity, i.e. production potential was higher than was utilised. Withholding this reserve capacity helped bolster prices and reduce demand. But with erratic additions of non-OPEC supply and a tendency for certain OPEC members to cheat on their quota, oil prices tended to swing in an unpredictable manner through the period 1960 to 2000.
Since 2000 this situation has changed. Global demand for oil has continued to increase and to meet this demand much of the OPEC spare capacity has been switched on so that all but Saudi Arabia are now producing flat out.

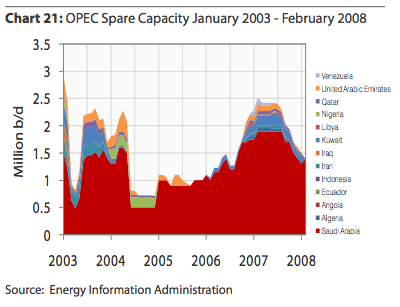
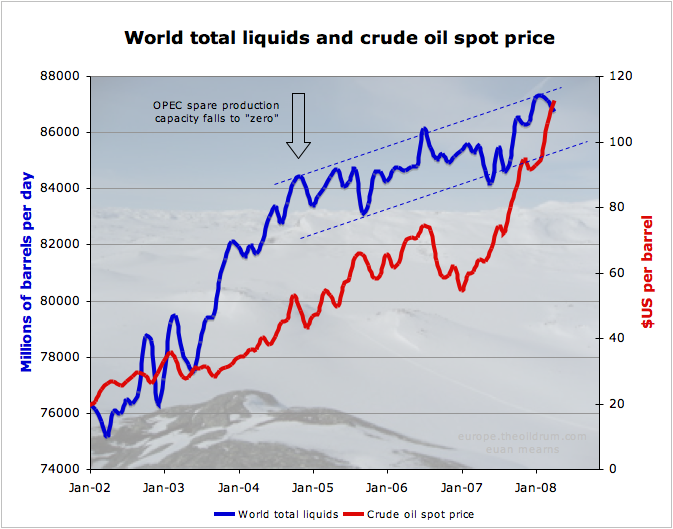
Global spare production capacity from this presentation by Lawrence Eagles of the IEA (link lost). Note how 8mmbpd spare capacity in 2002 had all but disappeared by 2004. It has since then grown slightly but is once again in decline.
This more detailed and up-to-date picture from Rembrandt Koppelaar's excellent May edition of oil watch monthly shows spare capacity in sharp decline. Despite a healthy inventory of mega-projects, the world is quite simply not managing to bring on new supply fast enough to compensate for decline.
In order to grow spare capacity, the world each year must commission new capacity to compensate for decline and to accommodate increased demand:
spare capacity growth = new annual production capacity - (annual decline + consumption growth)
As demand continues to rise against static supply, the only solution is for prices to rise and to price poor people out of the oil consuming economy.
Much of the spare capacity held in Saudi Arabia is heavy sour crude oil and the world currently lacks capacity in specialised refineries to handle this crude.
Peak exports
Another important concept is to consider is oil exports as described here by Westexas and Khebab. Oil exporting countries have increasing wealth and are attracting massive inward investment and migration resulting in steadily rising oil consumption. Indonesia provides a classic example of a former export land whose rising consumption has totally consumed their oil exports. Indonesia, once part of the oil supply solution has become part of the oil demand problem and has just left OPEC.
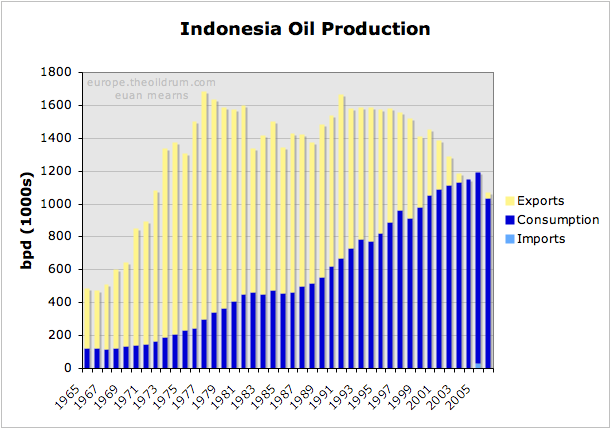
Rising demand and falling production has totally consumed Indonesia's oil exports in the space of 40 years. Indonesia's passion for bio-fuels is explained by this chart.
In 2006 Luis de Sousa produced this analysis of global oil exports. Those seeking an explanation for why oil now costs over $120 per barrel need look no further than this chart.

Luis de Sousa's analysis of net oil exports shows a peak in global oil exports in 2004/5 followed by a period of gradual decline until 2010. Net export decline then accelerates. If this analysis is correct then the current oil price / oil supply crisis will shortly get much worse. However, note that 4 important exporting countries - Iraq, Nigeria, Azebaijan and Kazakhstan - are not yet included in this analysis.
Oil is still cheap

At $2 per liter bottled spring water costs $318 per barrel.
Oil is still very cheap. Bottled spring water at $2 per litre works out at $318 per barrel. Oil is fundamental to our lives for transportation and a myriad products ranging from plastic to pesticides. Unlike spring water, oil is finite and costs significantly more to find and produce. The price of oil will continue to rise until the world as a whole decides it can do with less or until meaningful volumes of energy substitution take root.
Subsidies and taxation distort the market
Many of the world’s oil consumers do not pay the market price paid by the OECD. In Russia, the Middle East and China and many other countries oil and gasoline prices are subsidised. So the thirst of those consumers is not abated by current high spot price. Taxation in Europe and Japan also de-gears the impact of high oil price in those regions where high tax means that gasoline is already expensive. The impact of rising prices is felt less in these countries - though it is now beginning to bite.
Secondary factors and excuses
There are a range of secondary factors impacting the day to day fluctuations in oil price such as:
- Speculation
- Political unrest in producing countries
- The depreciation of the $US
- Prime exploration acreage that is off limits to OECD corporations
Speculation
Financial speculation in oil futures is being offered increasingly as the reason for high oil prices. True, speculation is rife. However, the futures market is a zero sum game. For every long position there is a short position and the price is ultimately struck by the individual who takes delivery of the oil - which is then refined and purchased by a consumer. For so long as consumers keep demanding oil at ever higher prices, the price will continue to rise.
The only way speculation could impact the oil price is under accumulation. Inventories of crude oil and refined products have been falling for a year (see figures 14 to 17).
Political unrest
True, political unrest in exporting countries such as Iraq and Nigeria means that less oil is being produced. But this situation has prevailed for many years now and is likely to get worse as energy poverty begins to bite.
The depreciation of the $US
True, the depreciation of the US$ has contributed to the rise in oil prices. But the oil price has risen in € too.
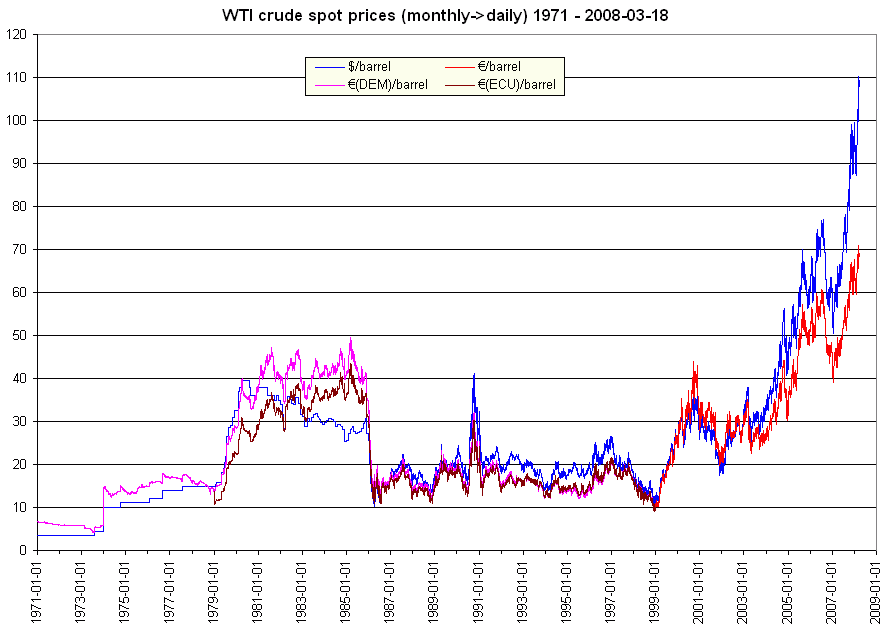
From Countdown to €100 oil by Jerome a Paris.
Off limits exploration
True, there are vast tracts of the USA that are under-explored in the ANWR and off the east and west coasts where the US has placed a high price on protecting their own environment. But it is not true that the Middle East and Russia are under-explored and that greater access to these areas by OECD companies would transform the current situation.
In summary these secondary factors touted by the MSM, politicians and oil companies are nothing more than an excuse and a distraction from the core problem which is demand growth running ahead of supply growth for over three years now. If the USA, Russia or Saudi Arabia could turn on the taps and produce an additional 3 mmbpd, the oil price would fall tomorrow. But they can't and the only way the oil price will come down is by reduced demand brought about by pricing poor people out of the energy market and by deepening recession.
Conclusion
We are now in the early stages of a full blown energy crisis that was predictable if not wholly avoidable. Politicians are awaking to the crisis now that escalating energy costs make its existence plain to see. It is highly unlikely that politicians will now grasp the gravity of the situation that the OECD and rest of the world faces and the responses will likely be ineffectual and too little too late.
The principal reason for current high oil price is the proximity of a peak in global oil production. Politicians must understand this and then grasp that natural gas and coal supplies will follow oil down by mid century. Reducing taxes on energy consumption right now is the wrong thing to do. Taxation structure needs to be adjusted to oblige energy producing companies to re-invest wind fall profits in alternative energy sources on a truly massive scale.
Energy efficiency should be the guiding beacon of all policy decisions and this must apply equally to energy production and energy consumption.

O atraso de 1 ano não é muito adequado à habitual profundidade e antecipação da GLQL...
http://norteamos.blogspot.com/2007/05/sub-urbanizao-peak-oil-e-ferrovias.html